Abstract
1. Introduction
The National Institute of Standards and Technology reported in [1] that users estimated the cost savings to be $11.7 billion if the software they purchased contained 50% fewer bugs and errors. A removal of all bugs in the same development cycle that they were introduced would result in a cost saving of $38.3 billion! These are the cost savings estimated for end users, and there are of course additional savings for the developers. These figures emphasize that current testing methods are inadequate, and that helping reduce software bugs and errors is an important area of research with a substantial payoff.
As software systems become more complicated and increasingly embedded in the processes of business and government, the costs of software failures continue to escalate. Complex distributed system failures are among the most troublesome problems, as the various components interact in unanticipated ways. These highly interconnected systems often suffer from intermittent or transient failures that are particularly difficult to diagnose. Examples of such complex systems include the network-centric warfare architectures being explored by U.S. Department of Defense [2]. These are systems of systems that can be integrated to provide flexible and robust capabilities. However, the failure patterns can be embedded in large, multidimensional spaces of successful executions that are very difficult for humans to test and analyze.
Several approaches to testing have been advocated by researchers and practitioners, including automated test case generation. One of the important benefits of automatically generating test cases is freedom from cognitive bias [3]. When called upon to construct test cases, software developers usually suffer from biases that result in the under exploration of many testing regions. Knowledge of the system internals and operational expectations influence the design of test suites. Automated tools can augment the testing process by providing test cases that are not susceptible to the same biases as the human developers. Combining both human and machine-generated test cases from multiple sources may be the most robust strategy for many testing situations, especially for complex distributed systems.
Genetic algorithms are one technique that has been applied to test case generation with some success. This research builds on past work at the unit testing level [4] and proposes extensions aimed at systems testing. In particular, three main objectives are pursued.
- While genetic algorithms have shown promise at the unit testing level, one goal of this research is to explore such techniques for testing complex distributed systems. The transient, potentially convoluted, failures that often plague distributed systems may best be diagnosed through partially automated approaches that support software developers.
- In order to characterize complex system failures, a framework or vocabulary of important system-related environmental attributes, such as elapsed time or system load, must be developed. Several such dimensions are used to define the search space explored in this research.
- Lastly, this research begins to explore visualization techniques that might help software developers uncover and understand complex system failures. While genetic algorithms may produce evidence in the form of test cases, expressed in terms of environmental and system attributes, how that information is presented to developers is a critical issue. Ultimately, a collection of visualization and data mining techniques are likely to be useful in analyzing potential failure patterns.
Several researchers have noted that software testing is very much a model building exercise and that software “testing is applied epistemology” [5]. That is, how we know what we know is an important issue when facing software failures. Software testers must rely on sound research methods to make inferences regarding the possible causes of failures. This paper focuses on using genetic algorithms to produce test cases as a body of evidence for such model building efforts. A prototype complex, distributed system is used to demonstrate the approach. Generated test cases are then analyzed to determine the coverage of the test bed by error and non-error producing test cases. An improvement to the fitness function is made that helps the test data to focus on more even coverage of all errors rather than an in depth coverage of one or two, and a cursory coverage of others. Finally the results of this new fitness function are presented visually, the purpose of this section is to explain how this rich data source can be used to assist the tester in pinpointing errors and to demonstrate the effectiveness of the genetic algorithm.
2. Breeding Test Cases using Genetic Algorithms
Evolutionary computational methods have been of interest to computer scientists, mathematicians, biologists, psychologists, and other investigators since the earliest days of computing research. Mitchell [6] surveys some of the early work conducted on “evolution strategies” and other types of “evolutionary programming” efforts. Evolutionary algorithms for optimization and machine learning were among the first such topics researched. Genetic algorithms (GAs) with selection, crossover, and mutation were first introduced by Holland [7] as an adaptive search technique that mimics the processes of evolution to solve optimization problems when traditional methods are deemed to costly in processing time. For example, GAs and other adaptive search techniques have been used to find solutions to many NP-complete problems and have been applied in many areas, from scheduling to game playing, and from business modeling to gas turbine design. Adaptive search techniques are not guaranteed to find the optimal solution, however, they can often find a very good solution in a limited amount of time [8].
The application of genetic algorithms to software test data generation differs from traditional optimization problems, in that it is not an optimization problem where a single goal is sought, rather what is often optimized is the ‘coverage’ of the code under test. Most of the recent research has been on the structural approach to testing. These are so-called white box techniques that require knowledge of the target code. For example, [9],[10] examined statement and branch coverage; [11] applied GAs to branch testing; [12] analyzed boundary conditions; and [13],[14],[15] applied GAs to path testing.
There has been less research into functional testing, [16] treated the program as a black box and extracted from the code the necessary information to calculate the objective function. Alander et al. [17],[18] measured the time it takes for a process to run while undergoing stress testing in an embedded software environment. Their work is the most closely aligned to the research presented in this paper in two ways. First, program inputs are presented to the system under test and the response time is measured as a fitness value. No structural analysis of the code is performed. Second, the test beds are systems of systems; the first tested processing time extremes in an embedded system [17], the second a real-time distributed system [18]. Functional testing approaches, or black box techniques, seek to confirm that functions correctly implement specifications without analysis of the underlying code.
3. Genetic Algorithms for Unit Testing
Genetic algorithms are often used for optimization problems in which the evolution of a population is a search for a satisfactory solution given a set of constraints. In this current application, the genetic algorithm is used to generate good test cases, but the notion of goodness or fitness depends on results from previous testing cycles. That is, a relative rather than absolute fitness function is used. An example of changing fitness landscapes can be found in the work of [19] with a focus on co-evolution or so called “biological arms races.” For the generation of test cases, a relative fitness function changes along with the population, allowing subsequent generations to take advantage of any insights gleaned from past results stored in the fossil record. This fossil record contains all previously generated test cases and information about the type of error generated, if any, and when that test case was run. Thus, the fossil record provides an environmental context for changing notions of fitness by comparing a test case to previously generated test cases and rewarding the individual based on the following concepts.
- Novelty is a measure of the uniqueness of a particular test case. In the context of method invocations, this can be quantified by measuring the distance in parameter space from previous invocations stored in the fossil record.
- Proximity is a measure of closeness to other test cases that resulted in system failures. This construct requires both the test case description and the execution result that can only be determined by stepping outside the genetic algorithm and executing the test case.
- Severity is measure of the seriousness of a system error. Not all problems are of equal severity. A total system failure or “blue screen of death” is probably worse than a violation of a response time requirement. Deciding on the severity of a spectrum of failure modes allows the system to be customized to particular application domains.
The interplay between these changing factors over successive generations gives rise to surprisingly complex search behaviors that can be characterized in terms of explorers, prospectors, and miners. That is, simple rules, complex behaviors.
The highly iterative search process can best be described in terms of explorers, prospectors,
and miners. An explorer is a test case that is highly novel, irrespective of whether
it results in success or failure. Essentially, explorers are the test cases that are
spread across the lightly populated regions of the test space. Once an error is discovered,
the fitness function encourages more thorough testing of the region. Prospectors are
test cases that are still somewhat unique, but are also near newly found errors. Therefore,
both novelty and proximity combine in the fitness function to generate prospectors.
As prospectors uncover additional errors, the fitness function will reward points
that are simply near other errors. Miners characterize such test cases that are generated
to more fully probe an area in which errors have been previously located. The interplay
of these various types of test cases tends to focus attention on error-laden areas,
while still generating some points over widespread regions of the test space. Figure 1 is a visualization of the fossil record of test cases for a simple object-oriented
program, TriTyp, used by other software researchers. Again, this is a unit testing perspective based
on input parameters, for a more complete discussion see [4]. Spikes indicate many test cases in areas where errors were uncovered with other
test cases more randomly distributed. In this current project, new attributes are
proposed for use in broadening the search space for systems level testing.
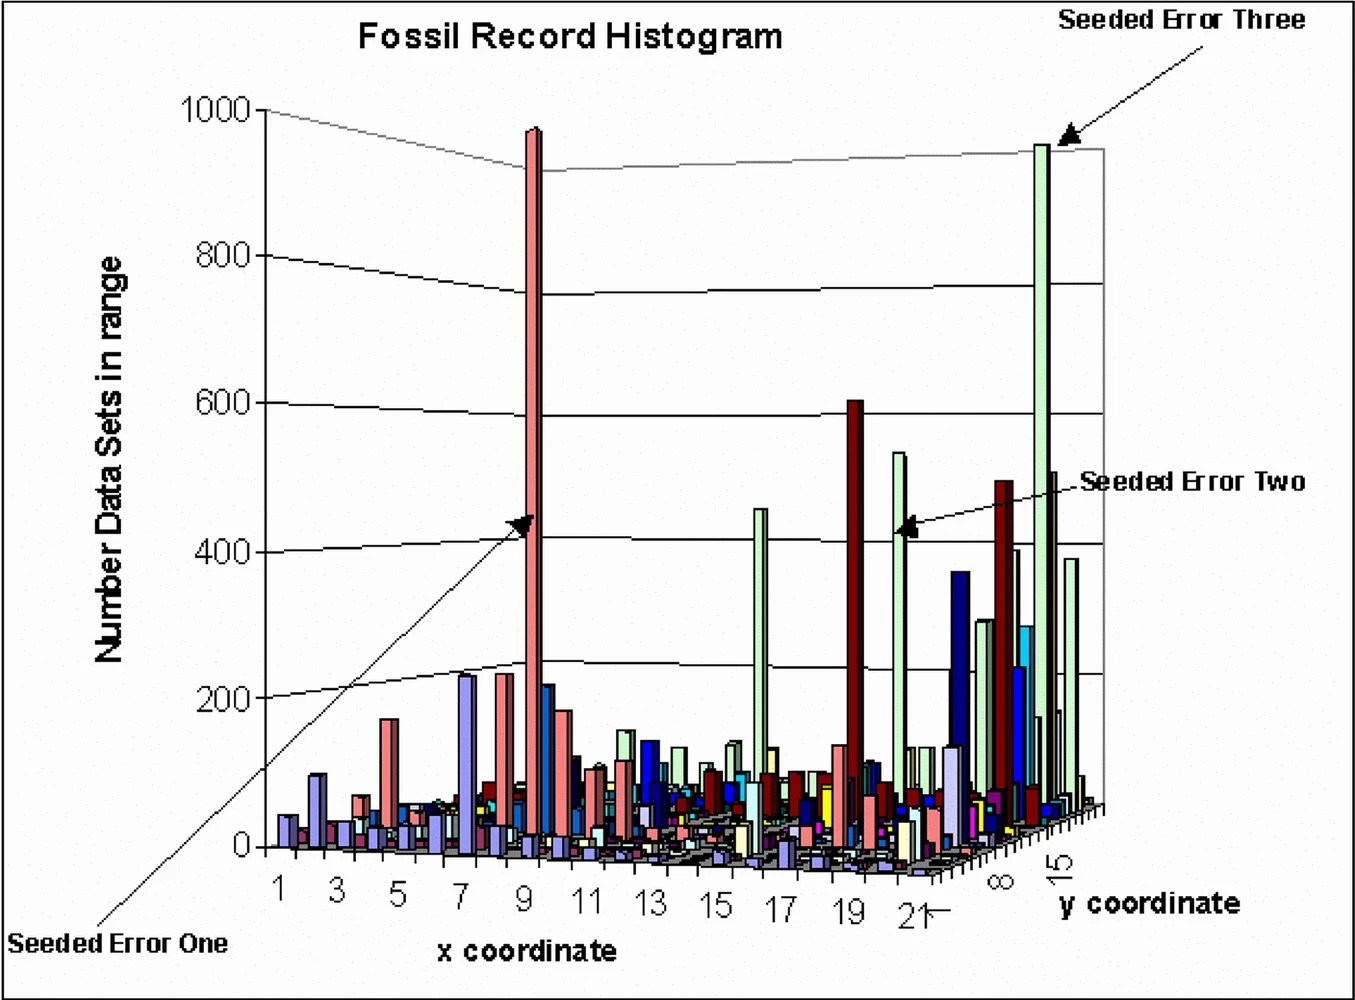
Figure 1.Figure 1.
4. Genetic Algorithms for Systems Testing
Moving from a unit testing to systems testing perspective is one of the goals of this current work. Complex systems fail as the various components interact in unanticipated ways. Examples of such complex systems are the network-centric warfare architectures being explored by U.S. Department of Defense [2]. These are systems of systems that can be integrated to provide flexible and robust capabilities. However, the failure patterns can be embedded in large, multidimensional spaces of successful executions that are very difficult for humans to analyze
From a systems testing perspective, new environmental attributes become important, for instance [20] identifies the types of failures that can occur when the distributed system fails to respond to a request this is an omission failure, or the response is untimely, a timing failure. Ghosh and Mathur [21] highlight the importance of stress testing systems under varying load levels. Zhang and Cheung [22] focus on stress testing multimedia systems, pointing out that network congestion and transmission errors or delays interrupt data delivery. Building upon these ideas the following list of attributes has been created, along with required input parameters for execution. The system used for research purposes is LobNet, a test bed developed as a multi-tiered, distributed system that calculates targeting information for simple ballistic weapons.
- ResponseTime in milliseconds (ms or msec) or units of one thousandth of a second. This is commonly used to measure disk access times and Internet packet travel times, and therefore, a reasonably natural measure for distributed system execution time. This is used to quantify response time violations and other time-related software failures.
- ElapsedTime in hours can be used to identify software failures that occur after prolonged running times. Examples of related faults include memory leaks, counters, fixed-sized arrays, and other bounded structures that may overflow after extended periods. For purposes of this research, the interval [0, 43, 800] or roughly 5 years is used.
- Cyclical temporal units, such as DayOfWeek (7), HourOfDay (24), MonthOfYear (12) can be used to uncover repetitive failures, such as planned maintenance activities, demanding batch jobs, periodic data loads, or any other scheduled tasks that might coincide with software failures.
- Load factors from the various tiers, such as AppLoad, DBLoad, WebLoad, characterize the computational demands on different components (using a 16 point scale). Excessive stress on any of these tiers may be associated with response time problems or outright failures. Of course, these load factors can be tailored to the target system architecture, but these three provide a basic framework for use in the case study.
- A second set of load factors concentrate on the network layers, including the WANLoad, LANLoad, and SANLoad, again using a 16 point scale. Excessive network traffic can also affect system response time, as well as failure modes. All of these environmental factors can interact during failures. For instance, local network loads may spike upward as a regularly schedule task places demands on system resources.
- System specific input parameters are part of any test case. For the simple LobNet test bed, there are three parameters, WeaponID (5), DistanceToTarget in meters [0, 6000], desired TimeOfImpact in seconds [0, 86, 400] over 24 hours.
- Lastly, the results of an execution include an ExceptionCode [0, 8] and a StackTrace that introduces some program state into the data set.
These system environment attributes, input parameters, and execution results represent an extended test case search space. The system attributes represent an important resource for identifying patterns in failures. In a sense, the system attributes and calling stack are fragments of program state, making this a gray rather than black box approach. This basic set could obviously be extended in many ways, but provides an initial vocabulary to describe interesting patterns.
The search space is very large, but genetic algorithms have been shown to be a very effective search technique. Holland [7] provided a theoretical basis for the power of genetic algorithms called schema theory, which showed that genetic algorithms derive much of their power from manipulating fit building blocks. The search problem at hand seems to be appropriate, with the system attributes and parameters providing building blocks that combine to partially identify failure patterns. Genetic algorithms may have problems identifying isolated solutions surrounded by low fitness regions, basically a “needle in a haystack” [8]. In software failures, this would correspond to a very rare and complicated interaction of many attributes that causes a single failure. While these certainly occur, the bulk of software errors are likely to be less exotic and reasonable targets for genetic algorithm-based approaches. Secondly, finding a needle in a haystack is pretty much a matter of luck for any search technique.
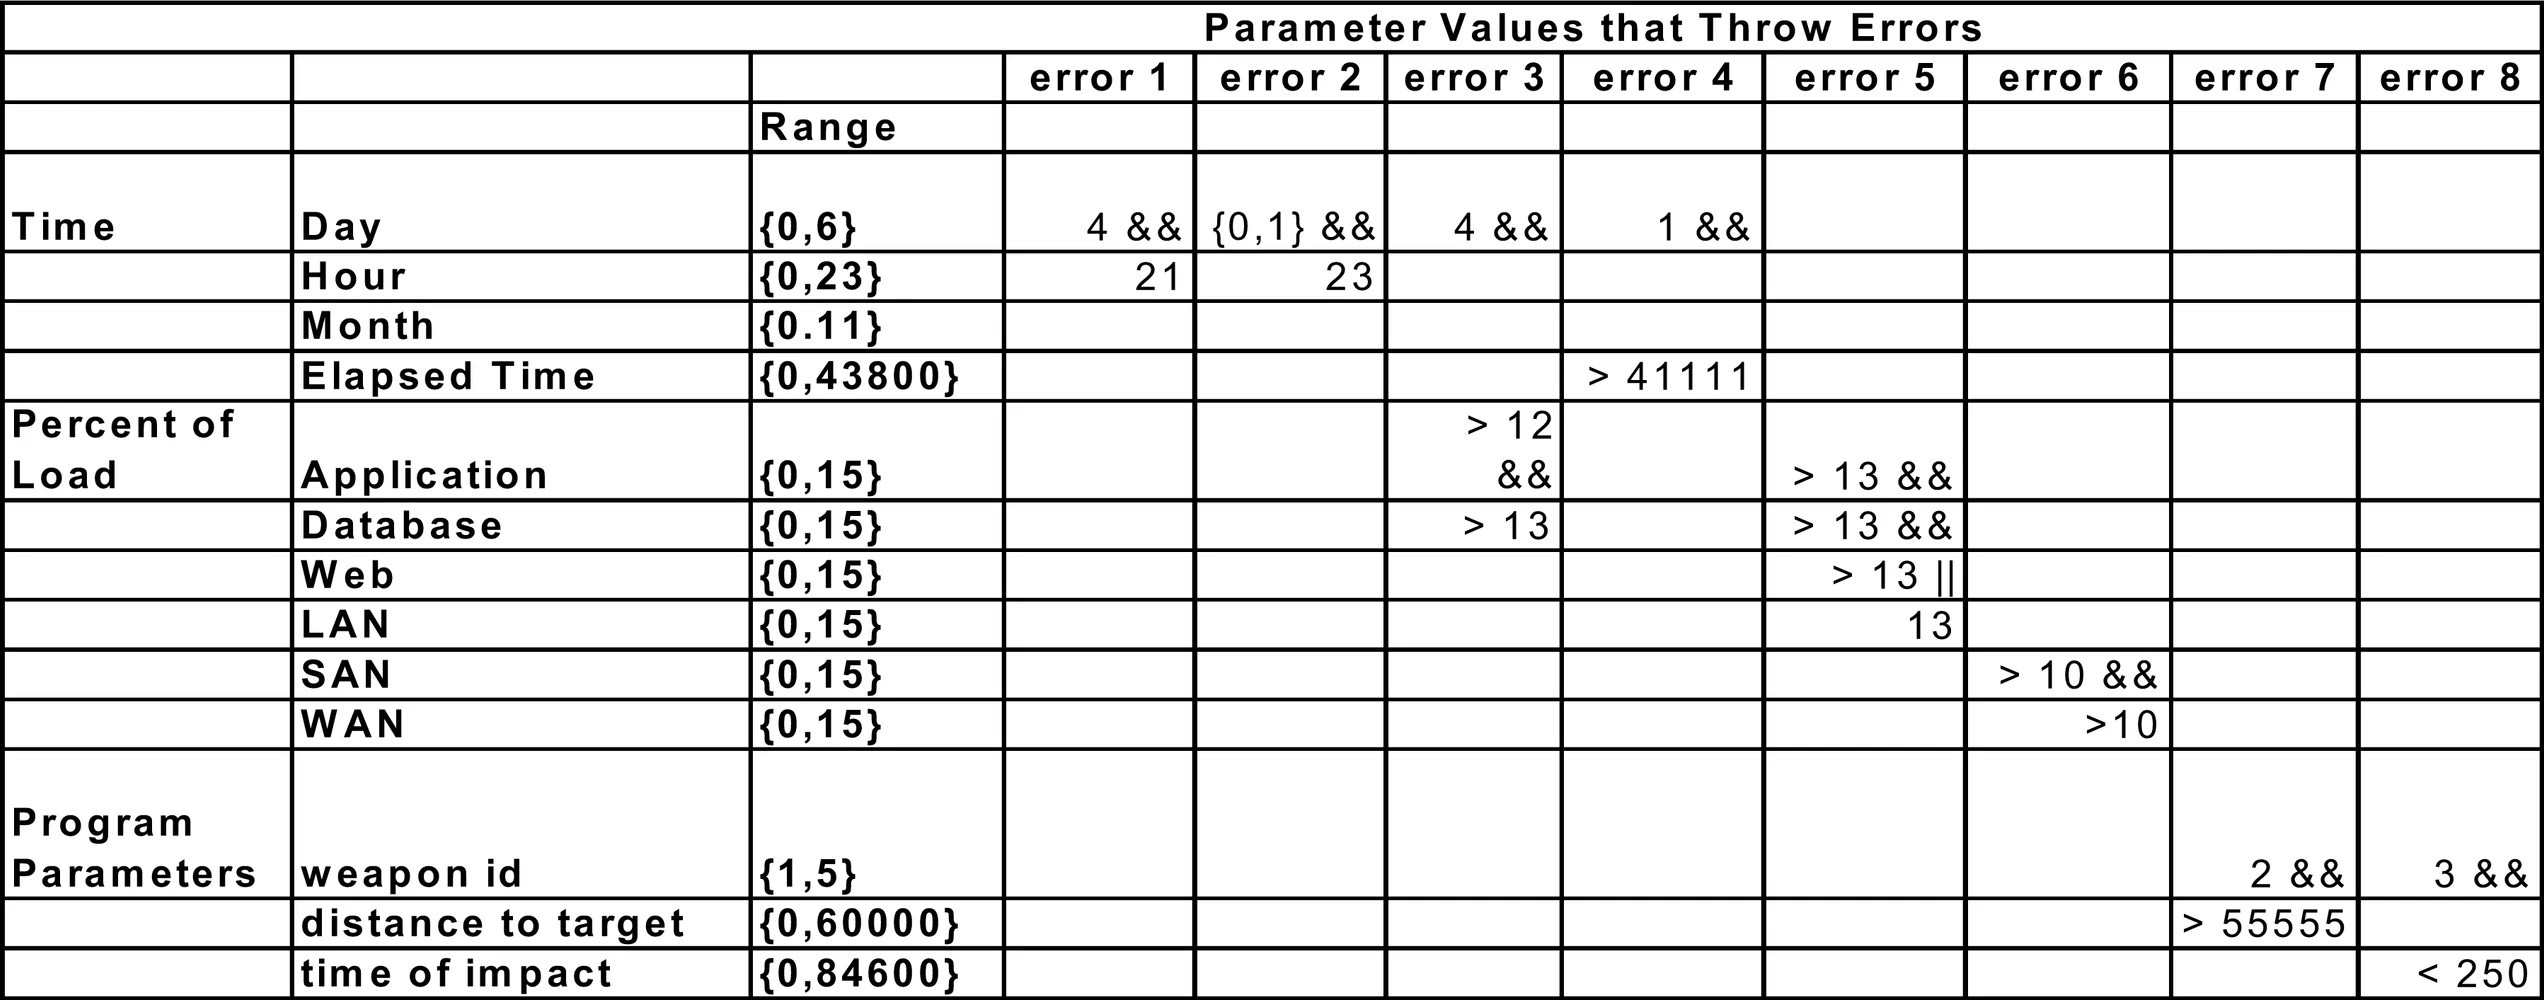
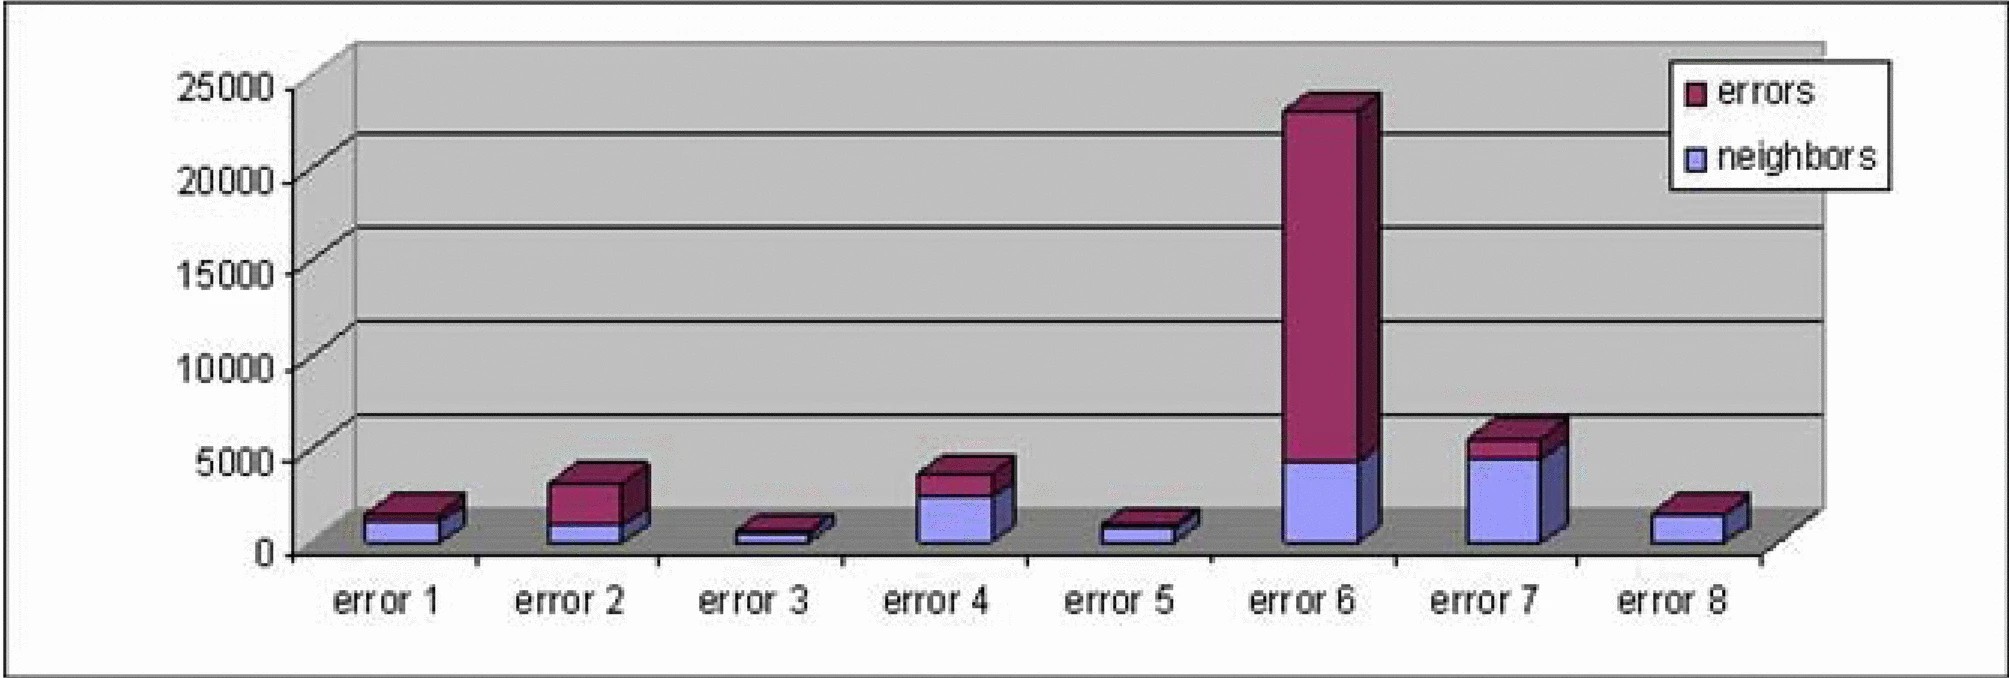
Figure 2.Figure 2.
5. LobNet: a Case Study
A genetic algorithm-based approach was used to generate the test cases. The target system, LobNet, was designed as a laboratory test bed and mirrors the distributed systems that characterize evolving network-centric warfare components. In order to investigate intermittent failures in such systems, eight errors of varying complexity were injected into LobNet, using the system environment attributes discussed above, such as elapsed time, load factors, and calendar time. Each of these errors throws an exception code (coded 1–8, with 0 indicating a successful execution). The errors are summarized in Table 1, including the logical conditions for throwing an exception. Along with the exception code, a stack trace is also available and could be used as category label for classification.
Two teams were formed. One team was responsible for seeding the errors, based on combinations of the input parameters and/or system environment attributes. The second team used a genetic algorithm to generate test cases, constructing a database of test results. In this way, the quality of test cases as body of evidence for subsequent analysis and model building can be investigated. The test cases should adequately explore error regions, while still generating enough successful executions that discriminatory models can be built. One way to assess the search behavior is to visualize the resulting fossil record, contrasting the density of test cases in and around errors with normal executions.
As discussed previously, the fitness of a test case is based on its proximity to errors and other test cases, its novelty and whether it caused an error, the details of the function can be found in [4]. All of the attributes were used in calculating the fitness of a test case. The GA was run for 500 generations, which produced 29,678 unique test cases.
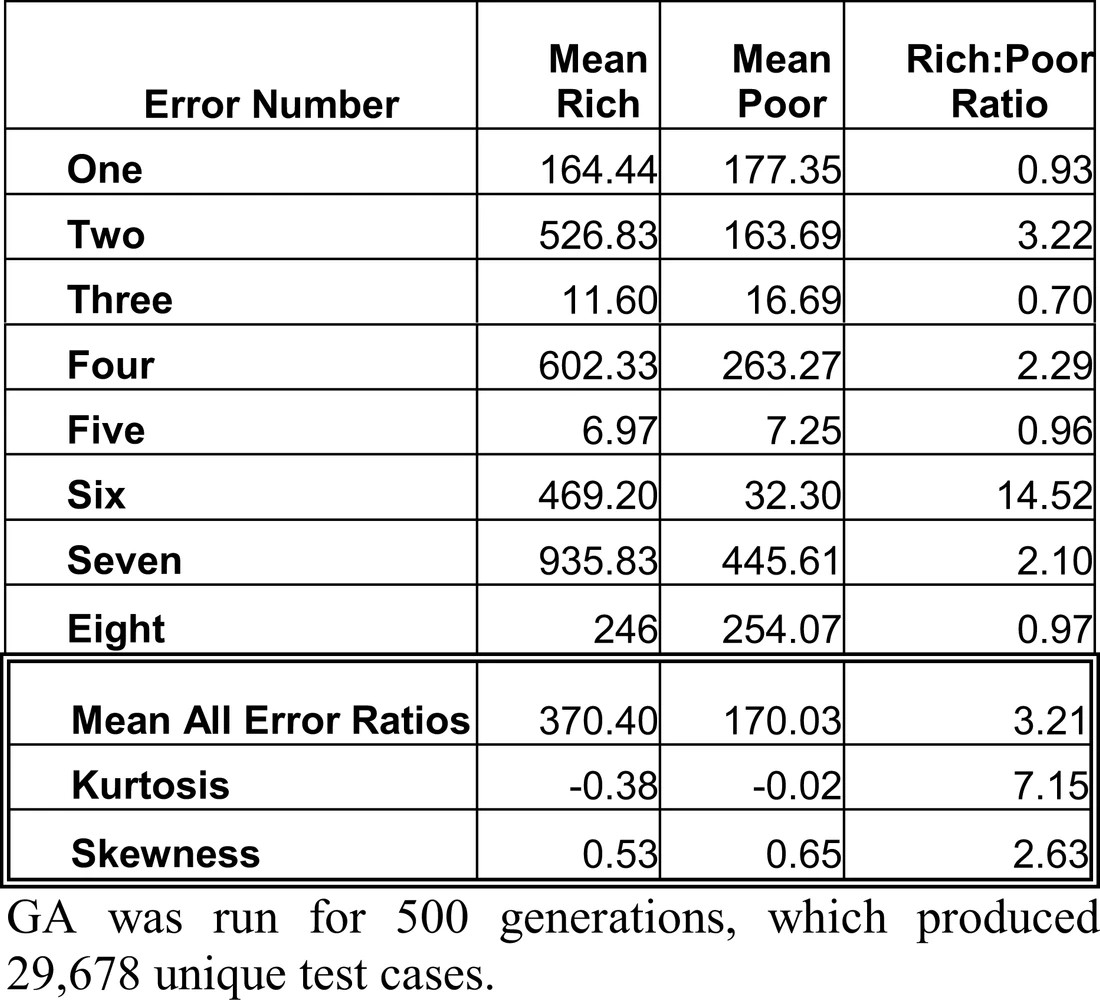
Figure 2 is a breakdown of rich points per error, each is further broken down into whether the test case produced an error or was a neighbor. Rich points are test cases that fall within an error region or are adjacent to that region, while poor points are spread across the remainder of the search space. These results make a strong statement, all the errors were found by the GA, yet there is a disproportionate number of test cases for error six. For reference, error six is the easiest error to find as it covers the largest amount of search space, 19%, while error eight is restricted to 3%. An analysis of the rich to poor ratio for individual errors is shown in Table 2. Due to the overwhelming amount of test data for error six, the other errors have much smaller ratios, four in fact have more poor test data than rich. Although the average ratio is 3.21: 1, individually it is not satisfactory, the skew is definitely positive and the kurtosis value shows the distribution to be leptokurtic, a higher peak than normal.
Although successfully finding and exploring all eight errors the results highlight an interesting problem, the GA may focus too intensively on specific error regions. Adequate testing requires that test data not only uncover errors but also have completed a good search of the poor point region The results displayed demonstrate what is needed are test sets that give good coverage of all errors, not a select few.
6. Goldilocks Implementation
A search strategy was devised which uses a breadth first approach to reward novel test cases that cover a larger area of the search space when the ratio is too high, and a depth first approach to build up error test cases when the ratio is too low (emphasizing proximity). Using both strategies to this advantage is not new, [23] proposed a new algorithm using a hybrid of the breadth first and depth first traversal strategies for the construction of binary decision diagrams. Even early expert systems used similar search techniques. For instance, Synchem, a synthetic chemistry expert system used an “effort distribution” algorithm to avoid tunnel vision [24].
To implement the strategy an ongoing count is kept of how many test cases have been
unearthed for each error, which is then divided by the total number of error-causing
test cases. This percentage is fed into the penalty feature and used to punish newly
generated test cases that cause the balance for a particular error to exceed 20%.
This percentage rule gives a good balance in allowing an error to thoroughly examine
its bounds before pressing the GA to search for more novel test cases. As shown in
the previous section, the depth-first search strategy is implemented naturally by
the existing fitness function as it attempts to optimize the number of test cases
for any error it finds, with the sometimes unfortunate consequence of an unbalanced
set of test cases. The breadth-first policy is implemented when errors are temporarily
marked as adequately covered, but once the count for a particular error falls below
20% it is encouraged to breed again.

Figure 3.Figure 3.
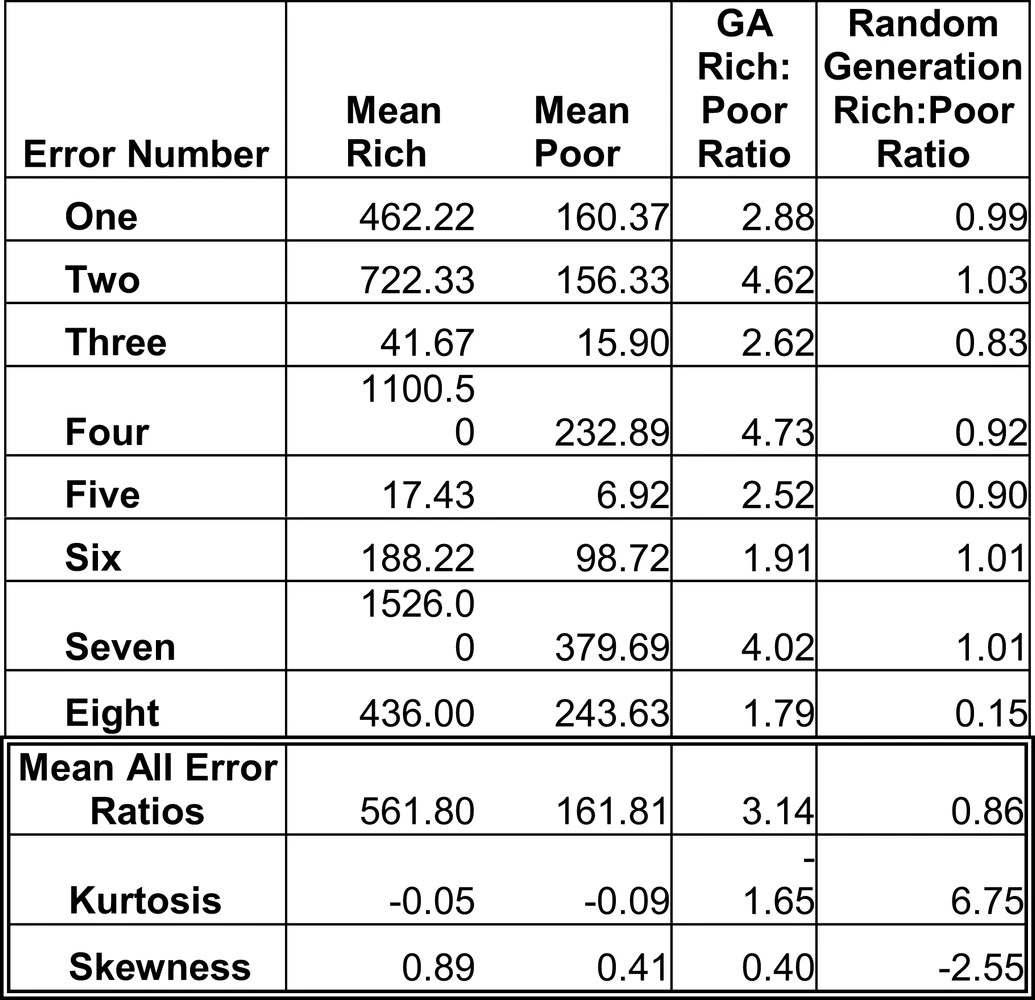
Figure 3 shows the distribution of the rich points with the implemented Goldilocks strategy. The scale on the chart is the same as in Figure 2 to illustrate the positive change in the distribution. The rich to poor ratios for all error is displayed in Table 3. The counts for each error still vary, however the variation is much more acceptable, no single error gets the lion's share of the search space.
7. Comparison to Random Generation
Test case generation by the GA can be compared to another common automated technique, random generation. As [25] points out random testing is inexpensive as all that is required is a random number generator and it is more stressing to the system than manual generation. Research by [26] also concluded that random testing was a useful validation tool. The downside to random generation is the lack of full coverage of a system. Our goal in this research has been to create test cases that generate errors and additional test cases in the neighborhood of errors. How do the results of the random generator compare? The test generator was run another 500 generations with all the features of the GA removed, comparison charts are shown in Figures 4 and 5, 71% of the test sets generated by the GA were error cases, compared to 14% generated randomly, the rich to poor ratios are shown in the last column of Table 3.
8. Test Data Visualization
Generating test data sets that are neighbors of errors is as important as generating test data sets that contain errors, this rich test data helps to define where an error boundary is and assists in analysis to determine what attributes created which errors and at what parameter values. This information will be invaluable in the debugging process. The body of evidence built by the GA can be visualized, statistically analyzed, sliced and diced using online analytic processing (OLAP) tools, and ultimately explored using data mining methods. In this section, several preliminary visualization techniques are investigated.
As the GA evolves it shows a tendency to breed test cases that overlap the rich point region of several errors, as shown in Figure 4 where 39% of the rich points overlapped, compared to 8% generated randomly. The benefit of overlapping is to give a richer test data set from which to mine test data for debugging and retesting. For example, these test data sets can be used to group causes of error, Figure 6 is a web of all the test cases generated for error one, the linkages highlight the neighboring errors (common rich points). There are no links between errors one and two, and errors one and four. A review of the cause of these errors, from Table 1, shows that they have one attribute in common, DayOfWeek, and therefore are mutually exclusive.
The histograms give excellent views of the search space as well. Figure 7 shows the three-dimensional view of the distribution. The towers indicate the rich
point regions, looking closely you can also see small ridges along day one and day
four, these indicate that there is more test data generated for these days than any
other. To the software tester unfamiliar with the seeded errors this may indicate
that days one and four play a part in more than just the combined errors with HourOfDay. One of the causes of the ridge is identified by viewing Figure 8 which is the histogram of Day Of Week and ElapsedTime. The large peak is the neighborhood for error three but the small peak represents
no error in this domain, however 55% of the test data generated for this small peak
is a neighbor of error one and a further 25% is for error three.
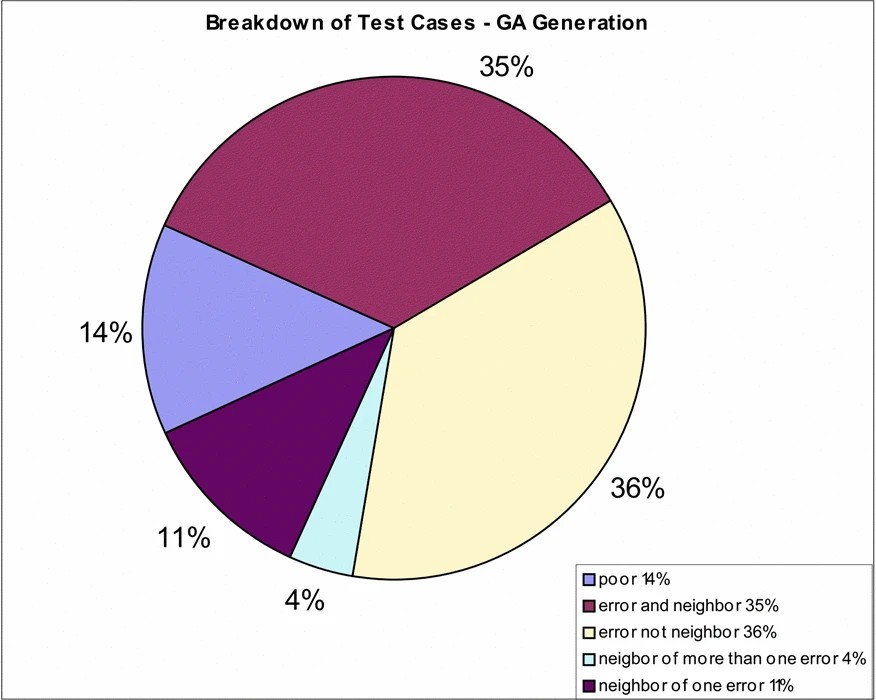
Figure 4.Figure 4.
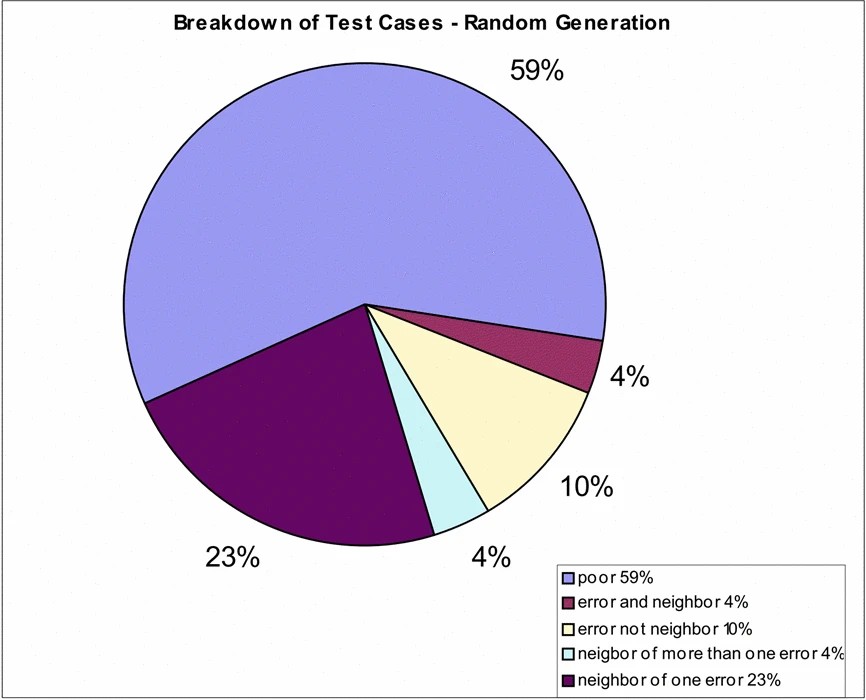
Figure 5.Figure 5.
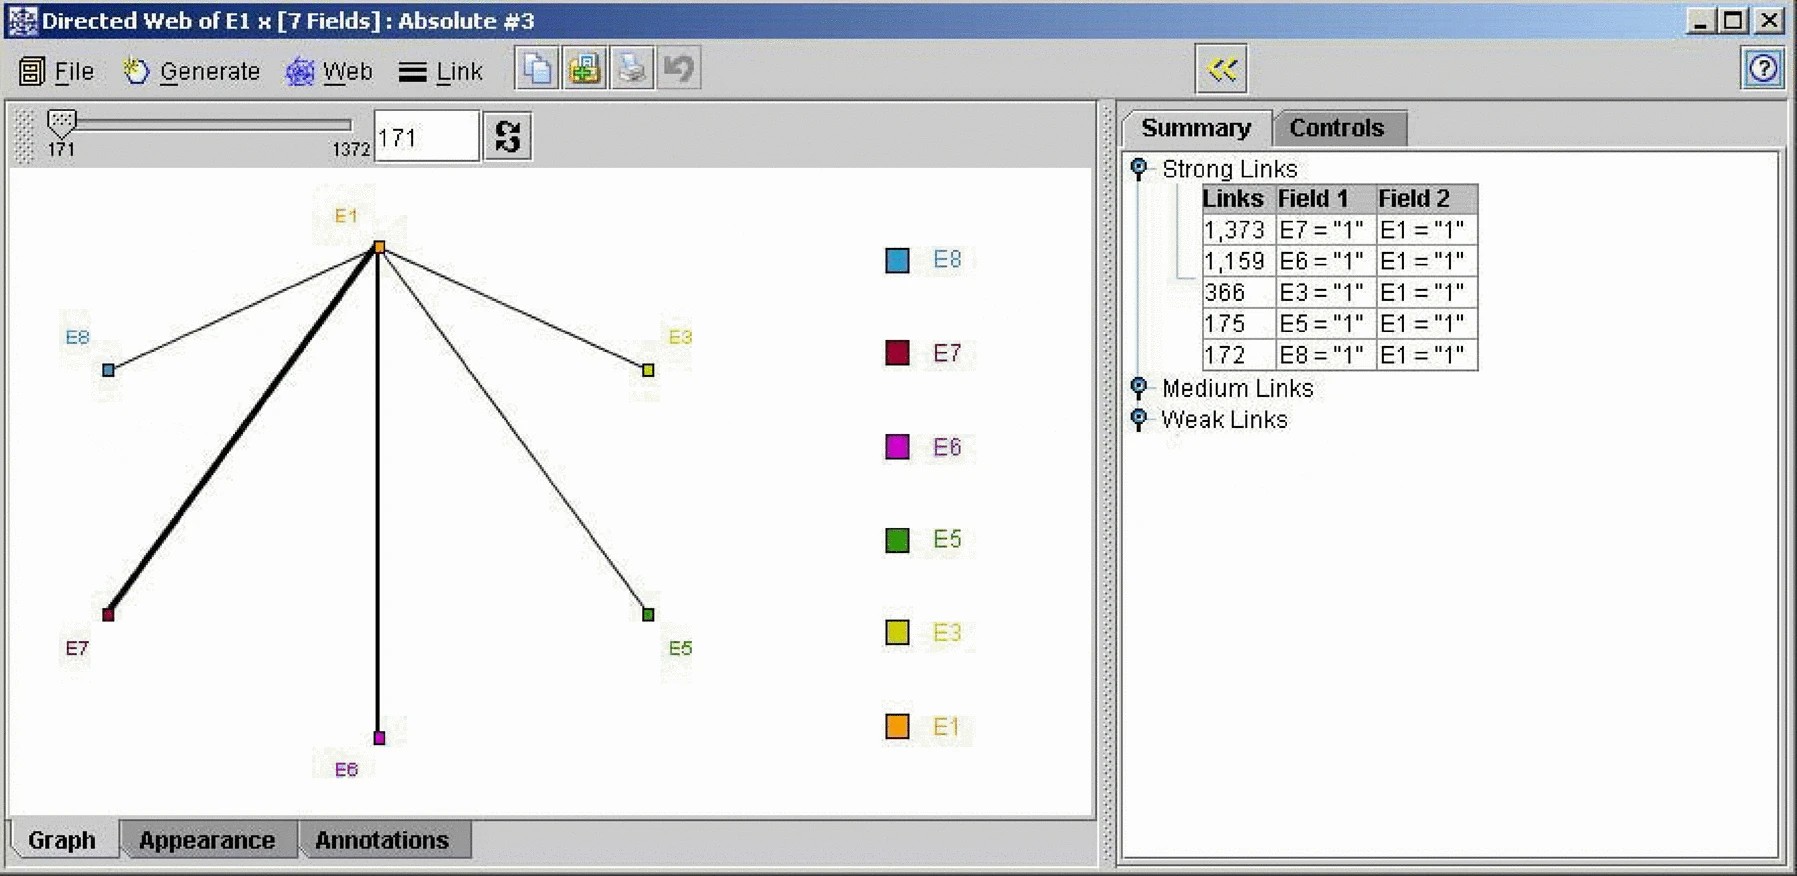
Figure 6.Figure 6.
9. Conclusion
Genetic algorithms are a powerful optimization tool, but they have proved themselves equally adept in an environment where they are used to generate test data. The LobNet experiments presented here have demonstrated that the GAs can generate test data sets at a systems testing level, with a focus on error regions of the code. An improvement has been made to the fitness function to make the number of test cases found for each error more uniform. The test data sets should be viewed as a rich resource allowing one to reproduce errors when testing and retesting, but also can be used to determine where in the code errors might exist by using histograms and distributions graphs. Additionally data mining tools can be used to determine the rules that caused the errors. This latter use is an area for future research.
A limitation to the research presented here is that the seeded errors were all expressed
in terms of the system attributes in our framework. Currently, we are focusing on
introducing noise, via exceptions that are only partially expressed using these attributes.
This will more realistically simulate a real-world environment. Of course, there is
no substitute for field use. A software-testing tool being developed under the auspices
of the National Institute for Systems Test and Productivity at the University of South
Florida will provide an interesting opportunity to apply these techniques in the field.
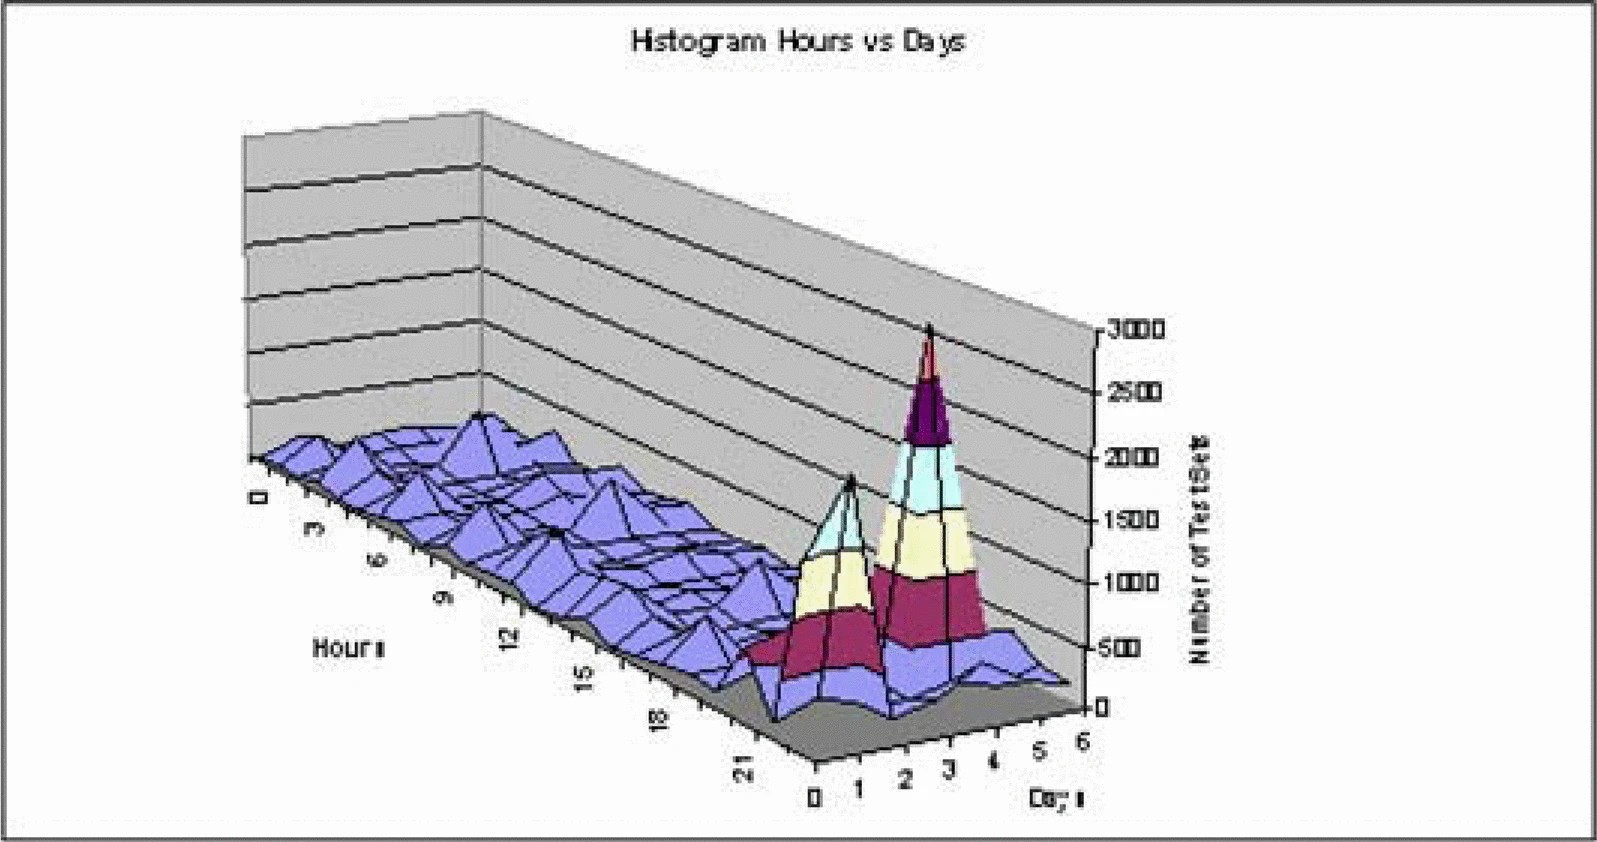
Figure 7.Figure 7.
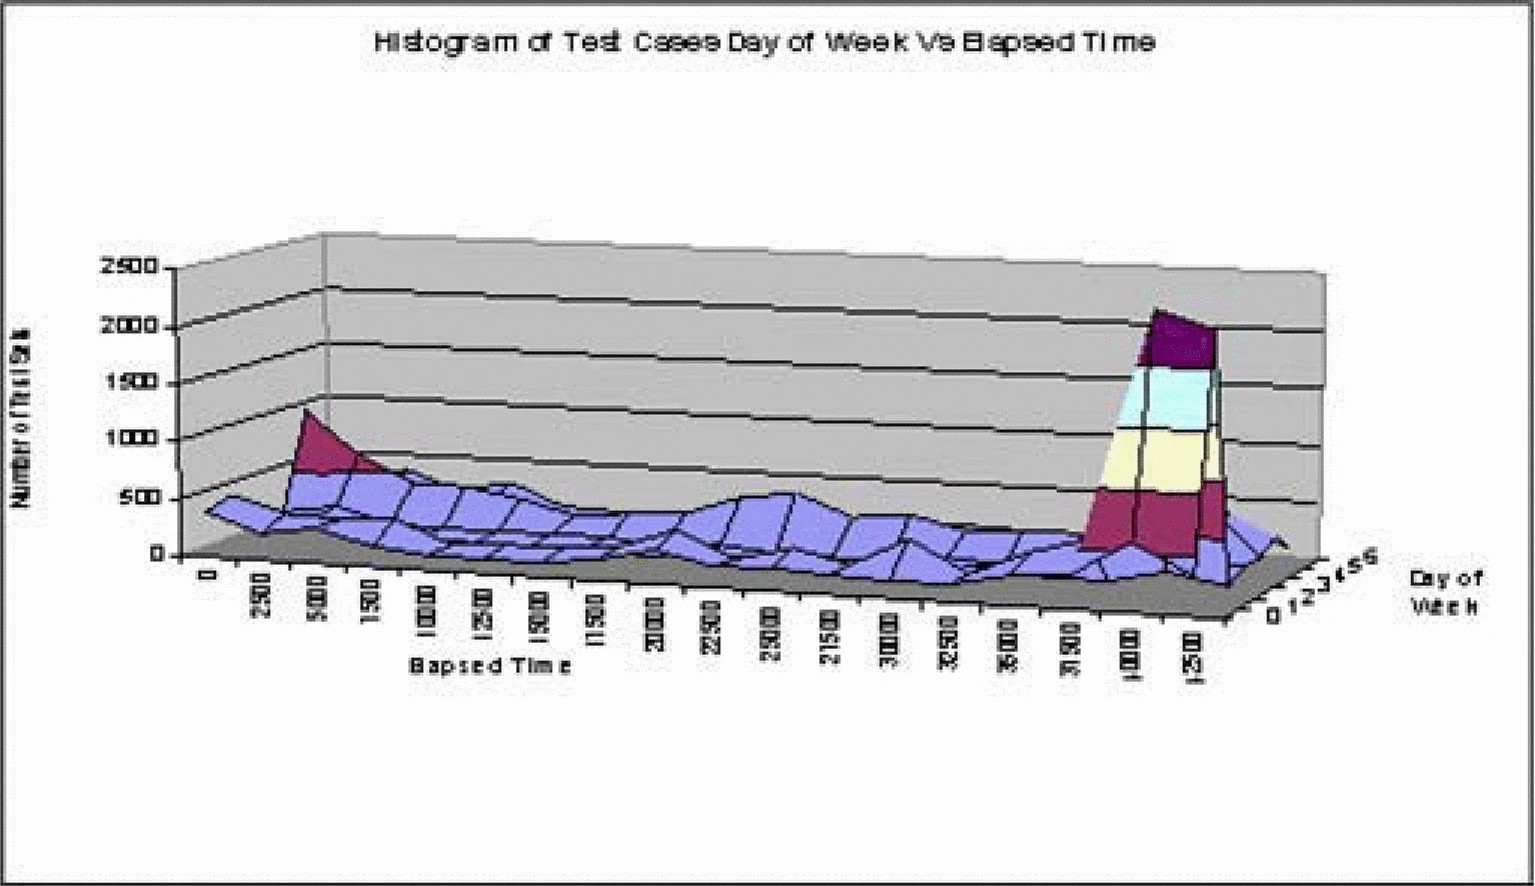
Figure 8.Figure 8.
References
- [1]Tassey, G. , “The Economic Impacts of Inadequate Infrastructure for Software Testing: Final Report,” National Institute of Standards and Technology, 2002.
- [2]Cebrowski, A.K. and J.J. Garstka, “Network-Centric Warfare: Its Origin and Future,” U.S. Naval Institute Proceedings, pages 28–35, January 1998.
- [3]Stacy, W. and J. Macmillian, “Cognitive Bias in Software Engineering,” Communications of the ACM, 38(6): 57–63, June1995.
- [4]Berndt, D.J. , J. Fisher, L. Johnson, J. Pinglikar and A. Watkins, “Breeding Software Test Cases with Genetic Algorithms,” Proceedings of the Hawaii International Conference on System Sciences, January 6-9, 2003
- [5]Kaner, C. , J. Bach and B. Pettichord, Lessons Learned in Software Testing, John Wiley & Sons, 2002.
- [6]Mitchell, M. , An Introduction to Genetic Algorithms, Cambridge, Massachusetts: MIT Press, 1996.
- [7]Holland, J. , Adaption in Natural and Artificial Systems, Ann Arbor, Michigan: University of Michigan Press, 1975.
- [8]Goldberg, D. , Genetic Algorithms in Search, Optimization, and Machine Learning, Boston, Massachusetts: Addison-Wesley, 1989.
- [9]Roper, M. , I. Maclean, A. Brooks, J. Miller and M. Wood, “Genetic Algorithms and the Automatic Generation of Test Data,” Working Paper, Department of Computer Science, University of Strathclyde, UK, 1991.
- [10]Pargas, R. , M. Harold and R. Peck, “Test Data Generation Using Genetic Algorithms,” Software Testing, Verification And Reliability, 9: 263–282, 1999.
- [11]Wegener, J. , A. Baresel and H. Sthamer, “Evolutionary Test Environment for Automatic Structural Testing,” Information & Software Technology, 2001.
- [12]Tracey, N. , J. Clark and K. Mander, “Automated Program Flaw Finding Using Simulated Annealing,” ISSTA-98, Clearwater Beach, Florida, USA, 1998.
- [13]Watkins, A. , “The Automatic Generation of Software Test Data using Genetic Algorithms,” Proceedings of the Fourth Software Quality Conference, 2: 300–309, Dundee, Scotland, July, 1995.
- [14]Borgelt, K. , “Software Test Data Generation From A Genetic Algorithm,” Industrial Applications Of Genetic Algorithms, CRC Press1998.
- [15]Lin, J-C. and P-U. Yeh,. “Automatic Test Data Generation for Path Testing using GAs,” Information Sciences, 131: 47–64, 2001.
- [16]Michael, C. , G. McGraw and M. Schatz, Generating Software Test Data by Evolution,” IEEE Transactions On Software Engineering, 27(12), December2001.
- [17]Alander, J. , T. Mantere, P. Turunen and J. Virolainen. “GA in Program Testing,” Proceedings of the 2NWGA, Vaasa, Finland, 19-23 August, pages 205–210, 1996.
- [18]Alander, J. , T. Mantere and P. Turunen, “Genetic Algorithm Based Software Testing,” in G. Smith, N. Steele and R. Albrecht, Editors, Artificial Neural Nets and Genetic Algorithms, Wien, Austria: Springer-Verlag, pages 325–328, 1998.
- [19]Hillis, W.D. , “Co-Evolving Parasites Improve Simulated Evolution as an Optimization Procedure, Physica D, 42: 228–234, 1990.
- [20]Cristian, F. , “Understanding Fault-Tolerant Distributed Systems,” Communications of the ACM, 34(2): 56–78. 1991.
- [21]Ghosh, S. and A. Mathur, “Issues in Testing Distributed Component-Based Systems,” Proceedings of the First International ICSE Workshop on Testing Distributed Component Based Systems, Los Angeles, CA, May 17, 1999.
- [22]Zhang, J and S.C. Cheung, “Automated Test Case Generation for the Stress Testing of Multimedia Systems,” Software - Practice and Exerience, 32: 1411–1435, 2002.
- [23]Chen, Y. , B. Yang and R. Bryant, “Breadth-First with Depth-First BDD Construction: A Hybrid Approach,” Technical Report CMU-CS-97–120, School of Computer Science, Carnegie Mellon University, 1997.
- [24]Gelernter, H.L. , G.A. Miller, D.L. Larsen and D.J. Berndt, “Realization of a Large Expert Problem-Solving System—SYNCHEM2: A Case Study,” Proceedings of the First Conference on Artificial Intelligence Applications, IEEE Computer Society, December 1984.
- [25]Ince, D.C. , “The Automatic Generation of Test Data,” The Computer Journal, 30(1): 63–69, 1987.
- [26]Duran, J and S. Ntafos, “A Report on Random Testing,” Proceedings of the 5th International Conference on Software Engineering, pages 179–183, 192.

